Q4 FY24 Earnings Results
Q4 FY24 earnings, Jan–Mar 2024: 5,481 Indian listed companies have reported; median profit growth is 0.0% on last year. Quarter ended 31 Mar 2024.
Reported
5,481
companies
Profit breadth
49% / 44%
grew / declined · 628 comparable
Median sales YoY
+8.7%
across all reporters
Median profit YoY
0.0%
across all reporters
Beat / missed
0 / 0
of 0 covered
Strongest / weakest
Forest Materials +190.5%
Telecom −374.3%
median profit growth, 10+ reporters
901–1,000 of 5,481
| Company | Revenue (₹ Cr) | Profit (₹ Cr) | Per share | 8Q profit | |||||
|---|---|---|---|---|---|---|---|---|---|
| Symbol | Sector | Reported | YoY | QoQ | Reported | YoY | EPS | vs consensus | Trend |
 POLYMED Poly Medicure Ltd | Healthcare | 378 | n/a | up+11.2% | 68 | n/a | 7.12 | No estimate | |
 CAMLINFINE Camlin Fine Sciences Ltd | Chemicals | 377 | n/a | down−2.3% | −82 | n/a | −4.11 | No estimate | |
 AVL Aditya Vision Ltd | Retail | 376 | n/a | down−9.0% | 8 | n/a | 0.61 | No estimate | |
 JEYYAM Jeyyam Global Foods Ltd | Food Products | 376 | n/a | n/a | 7 | n/a | 1.87 | No estimate | |
| GSAL (India) Ltd(Merged) | — | 375 | up+25.4% | up+6.8% | 164 | up+21.5% | 3.29 | No estimate | |
 GATEWAY Gateway Distriparks Ltd | Logistics & Cargo | 375 | n/a | down−4.6% | 56 | n/a | 1.10 | No estimate | |
 NEWGEN Newgen Software Technologies Ltd | Information Technology | 375 | n/a | up+15.7% | 105 | n/a | 7.50 | No estimate | |
 VSTIND VST Industries Ltd | Consumer Goods | 375 | n/a | up+3.3% | 88 | n/a | 5.19 | No estimate | |
 RCDL Rajgor Castor Derivatives Ltd | FMCG | 374 | up+83.3% | n/a | 6 | down−25.0% | 1.34 | No estimate | |
 AYMSYNTEX AYM Syntex Ltd | Textiles | 374 | n/a | up+12.8% | 19 | n/a | 3.82 | No estimate | |
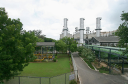 GIPCL Gujarat Industries Power Co Ltd | Power | 373 | n/a | up+5.4% | 66 | n/a | 4.38 | No estimate | |
 NAHARINDUS Nahar Industrial Enterprises Ltd | Textiles | 373 | n/a | up+2.5% | 19 | n/a | 4.43 | No estimate | |
| Wilwayfort India Ltd | Commodities | 373 | down−12.1% | up+5.4% | 66 | up+1.6% | 4.38 | No estimate | |
 KIOCL KIOCL Ltd | Metals & Mining | 372 | n/a | down−32.2% | −43 | n/a | −0.71 | No estimate | |
 GNA GNA Axles Ltd | Automobiles | 371 | n/a | up+3.9% | 17 | n/a | 3.90 | No estimate | |
 DYNAMATECH Dynamatic Technologies Ltd | Capital Goods | 370 | n/a | up+6.9% | 57 | n/a | 90.06 | No estimate | |
 SUKHJITS Sukhjit Starch & Chemicals Ltd | FMCG | 370 | n/a | up+2.5% | 12 | n/a | 3.81 | No estimate | |
 TBOTEK TBO Tek Ltd | Leisure Services | 369 | n/a | up+12.8% | 46 | n/a | 4.47 | No estimate | |
 UGARSUGAR Ugar Sugar Works Ltd | Consumer Goods | 368 | n/a | up+2.0% | 17 | n/a | 1.54 | No estimate | |
 TGVSL TGV Sraac Ltd | Chemicals | 368 | n/a | down−8.5% | 7 | n/a | 0.67 | No estimate | |
 DHANUKA Dhanuka Agritech Ltd | Chemicals | 368 | n/a | down−8.7% | 59 | n/a | 12.95 | No estimate | |
 SALASAR Salasar Techno Engineering Ltd | Capital Goods | 367 | n/a | up+20.9% | 17 | n/a | 0.11 | No estimate | |
| Sandur Laminates Ltd | Commodities | 366 | up+12.6% | up+7.3% | 54 | up+10.2% | 11.24 | No estimate | |
 ABSLAMC Aditya Birla Sun Life AMC Ltd | Capital Markets | 366 | n/a | up+7.3% | 208 | n/a | 7.23 | No estimate | |
 INDIGOPNTS Indigo Paints Ltd | Consumer Goods | 366 | n/a | up+7.3% | 54 | n/a | 11.24 | No estimate | |
 SWASTIK Swastik Pipe Ltd | Industrial Products | 366 | down−8.0% | n/a | 1 | down−88.9% | 0.44 | No estimate | |
 RAMCOIND Ramco Industries Ltd | Construction | 365 | n/a | up+9.3% | 44 | n/a | 5.05 | No estimate | |
 SAFARI Safari Industries (India) Ltd | Consumer Goods | 365 | n/a | down−5.9% | 43 | n/a | 8.86 | No estimate | |
 ANDHRAPAP Andhra Paper Ltd | Forest Materials | 364 | n/a | down−23.7% | 38 | n/a | 1.93 | No estimate | |
 CAMPUS Campus Activewear Ltd | Consumer Goods | 364 | n/a | down−22.9% | 33 | n/a | 1.07 | No estimate | |
 MANYAVAR Vedant Fashions Ltd | Retail | 363 | n/a | down−23.4% | 116 | n/a | 4.77 | No estimate | |
| Ras Extrusions Ltd (Merged) | — | 362 | up+30.7% | up+12.8% | 23 | up+76.9% | 2.87 | No estimate | |
 CYIENTDLM Cyient DLM Ltd | Capital Goods | 362 | n/a | up+12.8% | 23 | n/a | 2.87 | No estimate | |
 TRANSCOR Transcorp International Ltd | Financial Services | 361 | n/a | down−33.2% | −3 | n/a | −0.90 | No estimate | |
 KANORICHEM Kanoria Chemicals & Industries Ltd | Chemicals | 361 | n/a | up+5.6% | −16 | n/a | −2.12 | No estimate | |
 SIMPLEXINF Simplex Infrastructures Ltd | Construction | 361 | n/a | up+14.2% | 164 | n/a | 28.72 | No estimate | |
 VIYASH Viyash Scientific Ltd | Healthcare | 361 | n/a | up+9.7% | 1 | n/a | −0.04 | No estimate | |
| Punjab Lease Financing Ltd | — | 360 | up+11.1% | down−5.8% | 29 | up+45.0% | 1.87 | No estimate | |
 KALAMANDIR Sai Silks (Kalamandir) Ltd | Retail | 360 | n/a | down−5.8% | 29 | n/a | 1.87 | No estimate | |
 GOPAL Gopal Snacks Ltd | Food Products | 359 | n/a | down−2.4% | 26 | n/a | 2.10 | No estimate | |
 TI Tilaknagar Industries Ltd | Beverages | 359 | n/a | down−4.8% | 31 | n/a | 1.63 | No estimate | |
 SAMBHV Sambhv Steel Tubes Ltd | Industrial Products | 358 | n/a | n/a | 17 | n/a | 0.71 | No estimate | |
| Esquire Engineering Ltd | — | 357 | down−13.3% | up+10.9% | 38 | down−22.4% | 7.52 | No estimate | |
 ALKYLAMINE Alkyl Amines Chemicals Ltd | Chemicals | 357 | n/a | up+10.9% | 38 | n/a | 7.52 | No estimate | |
 POCL Pondy Oxides & Chemicals Ltd | Metals & Mining | 357 | n/a | down−21.4% | 12 | n/a | 1.95 | No estimate | |
 NOCIL NOCIL Ltd | Chemicals | 356 | n/a | up+4.4% | 42 | n/a | 2.49 | No estimate | |
| Allcargo Gati Ltd(Merged) | Services | 355 | down−14.6% | down−16.4% | −6 | n/a | −0.28 | No estimate | |
 ASTRAMICRO Astra Microwave Products Ltd | Aerospace & Defense | 354 | n/a | up+53.2% | 54 | n/a | 5.73 | No estimate | |
 BRGOYALINFRASTRUCTURELTD B.R.Goyal Infrastructure Ltd | Construction | 353 | n/a | n/a | 18 | n/a | 10.20 | No estimate | |
 SWARAJENG Swaraj Engines Ltd | Industrial Products | 351 | n/a | up+25.4% | 35 | n/a | 28.96 | No estimate | |
 AGARWALEYE Dr Agarwals Health Care Ltd | Healthcare Services | 349 | n/a | up+4.8% | 41 | n/a | — | No estimate | |
 AGSTRA AGS Transact Technologies Ltd | Financial Services | 349 | down−17.9% | down−6.7% | −4 | n/a | −0.37 | No estimate | |
 KDDL KDDL Ltd | Consumer Goods | 348 | n/a | down−6.5% | 35 | n/a | 20.40 | No estimate | |
 UDAICEMENT Udaipur Cement Works Ltd | Commodities | 348 | up+18.0% | up+16.0% | 18 | up+5.9% | 0.33 | No estimate | |
 SIMBHALS Simbhaoli Sugars Ltd | Consumer Goods | 348 | down−6.2% | up+13.9% | 37 | up+53.9% | 8.80 | No estimate | |
 FOODSIN Foods & Inns Ltd | Food Products | 345 | n/a | up+130.4% | 5 | n/a | 0.92 | No estimate | |
 Madhuban Constructions Ltd | — | 344 | up+10.1% | up+10.5% | 3 | down−23.9% | 1.17 | No estimate | |
 SIGIND Signet Industries Ltd | Commercial Services | 344 | n/a | up+10.5% | 3 | n/a | 1.17 | No estimate | |
 BANSWRAS Banswara Syntex Ltd | Textiles | 343 | n/a | up+13.6% | 8 | n/a | 2.48 | No estimate | |
| Webel Communication Industries Ltd | Telecommunication | 343 | down−7.0% | up+13.6% | 8 | down−72.4% | 2.48 | No estimate | |
 HAPPYFORGE Happy Forgings Ltd | Industrial Products | 343 | n/a | up+0.3% | 66 | n/a | 6.98 | No estimate | |
 REFEX Refex Industries Ltd | Energy | 342 | n/a | up+11.8% | 33 | n/a | 2.96 | No estimate | |
 BLKASHYAP B.L.Kashyap & Sons Ltd | Construction | 341 | n/a | up+5.2% | 24 | n/a | 1.05 | No estimate | |
 ESABINDIA Esab India Ltd | Industrial Products | 341 | n/a | up+13.3% | 44 | n/a | 28.75 | No estimate | |
 RAINBOW Rainbow Childrens Medicare Ltd | Healthcare Services | 341 | n/a | up+1.5% | 51 | n/a | 5.02 | No estimate | |
 MISHTANNFOODSLTD | Food Products | 338 | n/a | up+2.1% | 94 | n/a | 0.89 | No estimate | |
 PITTIENG Pitti Engineering Ltd | Capital Goods | 336 | n/a | up+11.3% | 46 | n/a | 14.35 | No estimate | |
 TRIGYN Trigyn Technologies Ltd | Information Technology | 334 | n/a | up+8.9% | 19 | n/a | 6.17 | No estimate | |
 DLINKINDIA D-Link India Ltd | Information Technology | 334 | n/a | up+13.6% | 25 | n/a | 7.07 | No estimate | |
 LLOYDSENT Lloyds Enterprises Ltd | Metals & Mining | 334 | n/a | up+3.1% | 46 | n/a | 0.14 | No estimate | |
 GRAUWEIL Grauer & Weil (India) Ltd | Chemicals | 333 | n/a | up+16.8% | 29 | n/a | 0.64 | No estimate | |
 SYMPHONY Symphony Ltd | Consumer Goods | 332 | n/a | up+34.4% | 48 | n/a | 6.96 | No estimate | |
 GTLINFRA GTL Infrastructure Ltd | Telecom | 331 | n/a | down−2.1% | −215 | n/a | −0.17 | No estimate | |
 HARIOMPIPE Hariom Pipe Industries Ltd | Industrial Products | 331 | n/a | up+18.2% | 17 | n/a | 5.81 | No estimate | |
 METROPOLIS Metropolis Healthcare Ltd | Healthcare Services | 331 | n/a | up+13.7% | 37 | n/a | 1.78 | No estimate | |
 LEMONTREE Lemon Tree Hotels Ltd | Leisure Services | 327 | n/a | up+12.8% | 84 | n/a | 0.85 | No estimate | |
 EKC Everest Kanto Cylinder Ltd | Capital Goods | 326 | n/a | down−0.9% | 13 | n/a | 1.29 | No estimate | |
 STOVEKRAFT Stove Kraft Ltd | Consumer Goods | 325 | n/a | down−10.2% | 3 | n/a | 0.80 | No estimate | |
 NORTHERNSPIRITSLTD | Commercial Services | 324 | n/a | up+3.3% | 5 | n/a | 3.02 | No estimate | |
 GUJARATTOOLROOMLTD | Industrial Products | 324 | up+19,662.2% | up+147.3% | 54 | up+7,280.8% | 0.77 | No estimate | |
 KORE Jay Jalaram Technologies Ltd | Retail | 323 | up+142.9% | n/a | 4 | up+100.0% | 3.78 | No estimate | |
 PARACABLES Paramount Communications Ltd | Industrial Products | 323 | n/a | up+13.7% | 29 | n/a | 0.97 | No estimate | |
 TTML Tata Teleservices (Maharashtra) Ltd | Telecom | 323 | n/a | up+9.1% | −309 | n/a | −1.58 | No estimate | |
 MAWANASUG Mawana Sugars Ltd | Consumer Goods | 322 | n/a | down−1.2% | 47 | n/a | 12.04 | No estimate | |
 BEPL Bhansali Engineering Polymers Ltd | Chemicals | 321 | n/a | up+9.9% | 40 | n/a | 1.62 | No estimate | |
 KOVAI Kovai Medical Center & Hospital Ltd | Healthcare Services | 321 | n/a | 0.0% | 52 | n/a | 47.69 | No estimate | |
 CONCORDBIO Concord Biotech Ltd | Healthcare | 319 | n/a | up+32.4% | 97 | n/a | 9.29 | No estimate | |
 ORIANA Oriana Power Ltd | Capital Goods | 319 | n/a | n/a | 49 | n/a | 5.07 | No estimate | |
 SALZERELEC Salzer Electronics Ltd | Capital Goods | 318 | n/a | up+21.0% | 12 | n/a | 6.95 | No estimate | |
 TCIEXP TCI Express Ltd | Logistics & Cargo | 317 | n/a | up+1.6% | 32 | n/a | 8.24 | No estimate | |
 ROLEXRINGS Rolex Rings Ltd | Automobiles | 316 | n/a | up+15.8% | 24 | n/a | 0.87 | No estimate | |
 RAJMET Rajnandini Metal Ltd | Capital Goods | 316 | n/a | up+6.1% | 0 | n/a | 0.01 | No estimate | |
| PNC Capital Trust Ltd | — | 315 | up+15.0% | up+2.9% | 31 | up+55.0% | 3.40 | No estimate | |
 INDIAMART Indiamart Intermesh Ltd | Retail | 315 | n/a | up+3.3% | 100 | n/a | 16.61 | No estimate | |
 INDRAMEDCO Indraprastha Medical Corporation Ltd | Healthcare Services | 315 | n/a | up+2.9% | 31 | n/a | 3.40 | No estimate | |
 PGINVIT Powergrid Infrastructure Investment Trust | Utilities | 314 | n/a | down−1.6% | 269 | n/a | 2.77 | No estimate | |
 OSIAHYPER Osia Hyper Retail Ltd | Retail | 313 | up+66.4% | down−11.9% | 5 | up+373.7% | 0.35 | No estimate | |
 STEELXIND Steel Exchange India Ltd | Industrial Products | 312 | n/a | up+21.9% | 20 | n/a | 0.16 | No estimate | |
 APCOTEXIND Apcotex Industries Ltd | Industrial Products | 311 | n/a | up+21.0% | 15 | n/a | 2.95 | No estimate | |
 BHARATRAS Bharat Rasayan Ltd | Chemicals | 310 | n/a | up+33.0% | 56 | n/a | 33.68 | No estimate | |
About Q4 FY24 earnings data
When are Q4 FY24 results announced?
Q4 FY24 covers the Jan–Mar 2024 quarter. Indian listed companies have up to 45 days after a quarter closes to file their results — 60 days for the January–March quarter — so results arrive in a wave over the weeks that follow rather than all at once. A quarter that has only just ended will look sparse and fill in.
Why do some Q4 FY24 growth figures show "n/a" instead of a percentage?
Growth is left blank whenever the comparison period was not profitable. A percentage change measured from a loss is arithmetic without meaning — a swing from a ₹10 crore loss to a ₹10 crore profit is not "200% growth", and publishing it as such would flatter the company. The reported figures for both periods are still shown, so the change is there to read directly.
Does the beat/miss verdict cover every company?
No analyst consensus was available for Q4 FY24, so no beat/miss verdict is shown. Revenue and profit growth are taken from reported results and cover every company in the table.
What counts as an in-line result rather than a beat or a miss?
Reported earnings per share within ±2% of the consensus estimate. The band is set there because a tighter one classifies rounding as news, and a wider one swallows surprises that genuinely moved a stock.
Are the figures consolidated or standalone?
Consolidated where a company reports on that basis, standalone otherwise, with all money in ₹ crore. Figures are as filed by the company with the exchanges (NSE/BSE); they are not restated or adjusted.
What does the 8-quarter trend line show?
Quarterly net profit for the last eight quarters, oldest on the left, always ending on the quarter shown in the row. Two years covers both the seasonal shape of the business and its direction. The line breaks where a quarter is missing rather than drawing across the gap, so a break is a real absence of data and not a reported collapse.
How do I find only the companies that beat estimates in Q4 FY24?
Use the Result filter above the table and choose Beat, or sort by EPS surprise to rank every covered company by how far it landed from consensus. Both are reflected in the page URL, so a filtered view can be bookmarked or shared.
Figures are as reported by companies in their quarterly filings to the exchanges (NSE/BSE), in ₹ crore. Consolidated results are shown where a company reports them, otherwise standalone. Year-on-year and quarter-on-quarter growth is omitted where the comparison period was loss-making, since a percentage change from a negative base is not meaningful. Analyst consensus is an estimate, not a forecast of outcome.