Q2 FY24 Earnings Results
Q2 FY24 earnings, Jul–Sep 2023: 5,345 Indian listed companies have reported; median profit growth is 0.0% on last year. Quarter ended 30 Sep 2023.
Reported
5,345
companies
Profit breadth
44% / 46%
grew / declined · 338 comparable
Median sales YoY
+8.0%
across all reporters
Median profit YoY
0.0%
across all reporters
Beat / missed
0 / 0
of 0 covered
Strongest / weakest
Petroleum Products +200.0%
Energy −157.9%
median profit growth, 10+ reporters
601–700 of 5,345
| Company | Revenue (₹ Cr) | Profit (₹ Cr) | Per share | 8Q profit | |||||
|---|---|---|---|---|---|---|---|---|---|
| Symbol | Sector | Reported | YoY | QoQ | Reported | YoY | EPS | vs consensus | Trend |
 WELENT Welspun Enterprises Ltd | Construction | 646 | n/a | down−7.6% | 69 | n/a | 4.48 | No estimate | |
 LUMAXIND Lumax Industries Ltd | Automobiles | 644 | n/a | up+4.2% | 26 | n/a | 28.08 | No estimate | |
 HDFCAMC HDFC Asset Management Company Ltd | Capital Markets | 643 | n/a | n/a | 438 | n/a | 10.25 | No estimate | |
 SAPPHIRE Sapphire Foods India Ltd | Leisure Services | 643 | n/a | down−1.7% | 15 | n/a | 0.48 | No estimate | |
 AARTIDRUGS Aarti Drugs Ltd | Healthcare | 642 | n/a | down−2.9% | 40 | n/a | 4.31 | No estimate | |
 DDEVPLSTIK DDev Plastiks Industries Ltd | Chemicals | 642 | n/a | up+0.6% | 42 | n/a | 4.08 | No estimate | |
 CONFIPET Confidence Petroleum India Ltd | Oil & Gas | 639 | n/a | down−27.0% | 31 | n/a | 0.94 | No estimate | |
 LUXIND Lux Industries Ltd | Textiles | 638 | n/a | up+22.5% | 38 | n/a | 12.75 | No estimate | |
| MINDSPACE Mindspace Business Parks REIT | Consumer Discretionary | 638 | n/a | up+7.6% | 150 | n/a | 2.38 | No estimate | |
 INDGN Indegene Ltd | Healthcare | 636 | n/a | up+4.6% | 75 | n/a | 3.38 | No estimate | |
 SANSERA Sansera Engineering Ltd | Automobiles | 630 | n/a | up+7.1% | 46 | n/a | 8.56 | No estimate | |
 SANGAMIND Sangam (India) Ltd | Textiles | 629 | n/a | down−7.1% | 7 | n/a | 1.55 | No estimate | |
 SPORTKING Sportking India Ltd | Textiles | 628 | n/a | up+16.5% | 16 | n/a | 1.22 | No estimate | |
 GMRP&UI GMR Power & Urban Infra Ltd | Power | 627 | n/a | down−44.2% | −123 | n/a | −1.74 | No estimate | |
 NAUKRI Info Edge (India) Ltd | Retail | 626 | n/a | 0.0% | 240 | n/a | 3.18 | No estimate | |
 RBA Restaurant Brands Asia Ltd | Leisure Services | 625 | n/a | up+2.3% | −51 | n/a | −0.93 | No estimate | |
 PSPPROJECT PSP Projects Ltd | Construction | 620 | n/a | up+20.6% | 39 | n/a | 10.70 | No estimate | |
 INTELLECT Intellect Design Arena Ltd | Information Technology | 619 | n/a | down−3.1% | 71 | n/a | 5.16 | No estimate | |
 MVGJL Manoj Vaibhav Gems N Jewellers Ltd | Consumer Goods | 619 | n/a | up+21.6% | 22 | n/a | 4.54 | No estimate | |
 DHANUKA Dhanuka Agritech Ltd | Chemicals | 618 | n/a | up+67.5% | 102 | n/a | 22.33 | No estimate | |
 RUSTOMJEE Keystone Realtors Ltd | Realty | 618 | n/a | up+127.2% | 4 | n/a | 0.38 | No estimate | |
 BDL Bharat Dynamics Ltd | Aerospace & Defense | 616 | n/a | up+106.7% | 147 | n/a | 4.01 | No estimate | |
 AGI AGI Greenpac Ltd | Industrial Products | 615 | n/a | up+10.2% | 56 | n/a | 8.68 | No estimate | |
 WESTLIFE Westlife Foodworld Ltd | Leisure Services | 615 | n/a | 0.0% | 22 | n/a | 1.43 | No estimate | |
 HEGAM HEG Ltd | Industrial Products | 614 | n/a | down−8.5% | 96 | n/a | 4.97 | No estimate | |
 HEGAM HEG Advanced Materials Ltd | Industrials | 614 | n/a | down−8.5% | 96 | n/a | 4.97 | No estimate | |
| SHIVTEXCHEMLTD | Chemicals | 613 | n/a | n/a | 11 | n/a | 8.92 | No estimate | |
 JAYBARMARU Jay Bharat Maruti Ltd | Automobiles | 613 | n/a | up+15.0% | 9 | n/a | 0.80 | No estimate | |
 SFL Sheela Foam Ltd | Consumer Goods | 613 | n/a | down−5.0% | 44 | n/a | 4.04 | No estimate | |
 HINDNATGLS Hindusthan National Glass & Industries Ltd | Industrials | 612 | up+7.0% | down−12.7% | 65 | n/a | 7.25 | No estimate | |
 RML Rane (Madras) Ltd | Automobiles | 611 | n/a | up+3.9% | 18 | n/a | 10.93 | No estimate | |
 CCL CCL Products (India) Ltd | Consumer Goods | 608 | n/a | n/a | 61 | n/a | 4.57 | No estimate | |
 JIOFIN Jio Financial Services Ltd | Financial Services | 608 | n/a | n/a | 668 | n/a | 1.05 | No estimate | |
 JAMNAAUTO Jamna Auto Industries Ltd | Automobiles | 607 | n/a | up+5.6% | 50 | n/a | 1.26 | No estimate | |
 UTTAMSUGAR Uttam Sugar Mills Ltd | Consumer Goods | 604 | n/a | up+31.3% | 16 | n/a | 4.10 | No estimate | |
 GREENLAM Greenlam Industries Ltd | Consumer Goods | 604 | n/a | up+17.3% | 39 | n/a | 1.54 | No estimate | |
 SUNLITE Sunlite Recycling Industries Ltd | Industrial Products | 604 | n/a | n/a | 4 | n/a | 10.30 | No estimate | |
| Hitkari Industries Ltd | — | 604 | n/a | up+17.2% | 39 | n/a | 1.54 | No estimate | |
| Indusmin Foods Ltd | — | 603 | n/a | up+16.0% | 9 | n/a | 0.70 | No estimate | |
 BANSALWIRE Bansal Wire Industries Ltd | Industrials | 603 | n/a | n/a | 18 | n/a | 0.28 | No estimate | |
| Indage Restaurants & Leisure Ltd | Fast Moving Consumer Goods | 601 | n/a | up+11.1% | 111 | n/a | 6.55 | No estimate | |
 LALPATHLAB Dr Lal Pathlabs Ltd | Healthcare Services | 601 | n/a | up+11.1% | 111 | n/a | 6.55 | No estimate | |
 SUDARSCHEM Sudarshan Chemical Industries Ltd | Chemicals | 601 | n/a | down−1.2% | 18 | n/a | 2.58 | No estimate | |
| Bellary Steels & Alloys Ltd(liquidated) | — | 600 | n/a | up+3.9% | 9 | n/a | 1.49 | No estimate | |
| Forward Securities Ltd | — | 600 | n/a | up+39.2% | 49 | n/a | 38.92 | No estimate | |
 BANARISUG Bannari Amman Sugars Ltd | Consumer Goods | 600 | n/a | up+39.2% | 49 | n/a | 38.92 | No estimate | |
 LGBBROSLTD L G Balakrishnan & Bros Ltd | Automobiles | 600 | n/a | up+11.3% | 75 | n/a | 24.05 | No estimate | |
 UDS Updater Services Ltd | Commercial Services | 600 | n/a | up+3.8% | 9 | n/a | 1.49 | No estimate | |
 RAILTEL Railtel Corporation of India Ltd | Telecom | 599 | n/a | up+28.0% | 68 | n/a | 2.12 | No estimate | |
 BIKAJI Bikaji Foods International Ltd | Food Products | 598 | n/a | up+25.1% | 61 | n/a | 2.45 | No estimate | |
 TRANSCOR Transcorp International Ltd | Financial Services | 598 | n/a | down−7.0% | 0 | n/a | 0.12 | No estimate | |
 ALIVUS Alivus Life Sciences Ltd | Healthcare | 595 | n/a | up+2.9% | 119 | n/a | 9.69 | No estimate | |
 STYRENIX Styrenix Performance Materials Ltd | Chemicals | 595 | n/a | n/a | 56 | n/a | 32.08 | No estimate | |
 EUREKAFORB Eureka Forbes Ltd | Consumer Goods | 592 | n/a | up+17.2% | 25 | n/a | 1.32 | No estimate | |
 BLIL Balmer Lawrie Investment Ltd | Financial Services | 587 | n/a | down−1.2% | 64 | n/a | 1.83 | No estimate | |
 DCAL Dishman Carbogen Amcis Ltd | Healthcare | 587 | n/a | down−18.8% | −41 | n/a | −2.61 | No estimate | |
 SAGCEM Sagar Cements Ltd | Construction | 587 | n/a | up+8.7% | −11 | n/a | −0.64 | No estimate | |
 BALMLAWRIE Balmer Lawrie & Company Ltd | Diversified | 586 | n/a | down−1.0% | 63 | n/a | 3.73 | No estimate | |
 DBCORP D B Corp Ltd | Media | 586 | n/a | n/a | 100 | n/a | 5.63 | No estimate | |
 SIYSIL Siyaram Silk Mills Ltd | Textiles | 586 | n/a | up+65.1% | 61 | n/a | 13.08 | No estimate | |
 STARCEMENT Star Cement Ltd | Construction | 585 | n/a | down−23.0% | 41 | n/a | 1.01 | No estimate | |
 AUTOAXLES Automotive Axles Ltd | Automobiles | 584 | n/a | up+9.8% | 45 | n/a | 29.84 | No estimate | |
 JTEKTINDIA JTEKT India Ltd | Automobiles | 584 | n/a | up+22.3% | 30 | n/a | 1.13 | No estimate | |
 RAMKY Ramky Infrastructure Ltd | Construction | 582 | n/a | up+4.5% | 121 | n/a | 16.28 | No estimate | |
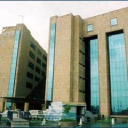 RITES Rites Ltd | Construction | 582 | n/a | up+7.0% | 110 | n/a | 2.10 | No estimate | |
 SHARDACROP Sharda Cropchem Ltd | Chemicals | 581 | n/a | down−8.9% | −28 | n/a | −3.06 | No estimate | |
| Gulshan Sugars & Chemicals Ltd(merged) | — | 580 | up+9.0% | up+11.1% | 21 | up+2,116.1% | 2.37 | No estimate | |
 DCMSRIND DCM Shriram Industries Ltd | Consumer Goods | 580 | n/a | up+11.1% | 20 | n/a | 2.32 | No estimate | |
 NACLIND NACL Industries Ltd | Chemicals | 580 | n/a | up+54.3% | 4 | n/a | 0.18 | No estimate | |
 PRICOLLTD | Automobiles | 578 | n/a | up+7.6% | 33 | n/a | 2.72 | No estimate | |
 PFIZER Pfizer Ltd | Healthcare | 575 | n/a | up+8.3% | 149 | n/a | 32.56 | No estimate | |
| India Green Reality Ltd | Consumer Discretionary | 574 | n/a | up+8.3% | 47 | n/a | 7.76 | No estimate | |
 PANAMAPET Panama Petrochem Ltd | Petroleum Products | 574 | n/a | up+8.3% | 47 | n/a | 7.76 | No estimate | |
 SPENCERS Spencers Retail Ltd | Retail | 574 | n/a | up+0.7% | −70 | n/a | −7.78 | No estimate | |
 GREENPLY Greenply Industries Ltd | Consumer Goods | 568 | n/a | up+32.1% | 14 | n/a | 1.13 | No estimate | |
| K Dhandapani & Co Ltd | — | 567 | n/a | down−0.5% | 13 | n/a | 4.53 | No estimate | |
 GLOBUSSPR Globus Spirits Ltd | Beverages | 567 | n/a | down−0.5% | 13 | n/a | 4.53 | No estimate | |
 ORIENTELEC Orient Electric Ltd | Consumer Goods | 567 | n/a | down−19.7% | 18 | n/a | 0.86 | No estimate | |
 HEIDELBERG HeidelbergCement India Ltd | Construction | 566 | n/a | down−5.0% | 36 | n/a | 1.58 | No estimate | |
 KSB KSB Ltd | Industrial Products | 564 | n/a | down−4.6% | 50 | n/a | 2.88 | No estimate | |
 HBLENGINE HBL Engineering Ltd | Automobiles | 557 | n/a | up+19.3% | 68 | n/a | 2.48 | No estimate | |
 METROBRAND Metro Brands Ltd | Consumer Goods | 556 | n/a | down−4.6% | 68 | n/a | 2.45 | No estimate | |
| Inlac Granston Ltd | — | 554 | n/a | down−45.6% | 58 | n/a | 6.49 | No estimate | |
 ASHAPURMIN Ashapura Minechem Ltd | Metals & Mining | 554 | n/a | down−45.6% | 58 | n/a | 6.49 | No estimate | |
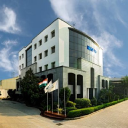 RICOAUTO Rico Auto Industries Ltd | Automobiles | 554 | n/a | up+3.7% | 6 | n/a | 0.50 | No estimate | |
 360ONE 360 ONE WAM Ltd | Capital Markets | 550 | n/a | n/a | 186 | n/a | 5.20 | No estimate | |
 VMART V-Mart Retail Ltd | Retail | 549 | n/a | down−19.1% | −64 | n/a | −8.11 | No estimate | |
 DPABHUSHAN D.P. Abhushan Ltd | Consumer Goods | 546 | n/a | up+15.9% | 13 | n/a | 5.99 | No estimate | |
 VIPIND V I P Industries Ltd | Consumer Goods | 546 | n/a | down−14.2% | 13 | n/a | 0.94 | No estimate | |
 IOLCP IOL Chemicals & Pharmaceuticals Ltd | Healthcare | 545 | n/a | down−3.2% | 38 | n/a | 1.29 | No estimate | |
 MUNJALAU Munjal Auto Industries Ltd | Automobiles | 545 | n/a | up+7.1% | 15 | n/a | 1.38 | No estimate | |
 CMSINFO CMS Info Systems Ltd | Commercial Services | 544 | n/a | up+6.3% | 84 | n/a | 5.39 | No estimate | |
 TIRUMALCHM Thirumalai Chemicals Ltd | Chemicals | 542 | n/a | up+3.6% | −6 | n/a | −0.59 | No estimate | |
 NXST Nexus Select Trust | Consumer Discretionary | 541 | n/a | up+88.5% | 251 | n/a | 1.66 | No estimate | |
| OSWALMIN Oswal Minerals Ltd | — | 541 | n/a | down−3.3% | −10 | n/a | −12.43 | No estimate | |
| Unique Agro Processors (India) Ltd | — | 540 | n/a | down−1.3% | 103 | n/a | 33.71 | No estimate | |
 FINEORG Fine Organic Industries Ltd | Chemicals | 540 | n/a | down−1.3% | 103 | n/a | 33.71 | No estimate | |
 JAYAGROGN Jayant Agro Organics Ltd | Chemicals | 540 | n/a | down−2.7% | 16 | n/a | 5.25 | No estimate | |
 DBOL Dhampur Bio Organics Ltd | Consumer Goods | 538 | n/a | down−7.7% | 0 | n/a | 0.01 | No estimate | |
 CENTRUM Centrum Capital Ltd | Financial Services | 533 | n/a | up+20.3% | −28 | n/a | −0.56 | No estimate | |
About Q2 FY24 earnings data
When are Q2 FY24 results announced?
Q2 FY24 covers the Jul–Sep 2023 quarter. Indian listed companies have up to 45 days after a quarter closes to file their results — 60 days for the January–March quarter — so results arrive in a wave over the weeks that follow rather than all at once. A quarter that has only just ended will look sparse and fill in.
Why do some Q2 FY24 growth figures show "n/a" instead of a percentage?
Growth is left blank whenever the comparison period was not profitable. A percentage change measured from a loss is arithmetic without meaning — a swing from a ₹10 crore loss to a ₹10 crore profit is not "200% growth", and publishing it as such would flatter the company. The reported figures for both periods are still shown, so the change is there to read directly.
Does the beat/miss verdict cover every company?
No analyst consensus was available for Q2 FY24, so no beat/miss verdict is shown. Revenue and profit growth are taken from reported results and cover every company in the table.
What counts as an in-line result rather than a beat or a miss?
Reported earnings per share within ±2% of the consensus estimate. The band is set there because a tighter one classifies rounding as news, and a wider one swallows surprises that genuinely moved a stock.
Are the figures consolidated or standalone?
Consolidated where a company reports on that basis, standalone otherwise, with all money in ₹ crore. Figures are as filed by the company with the exchanges (NSE/BSE); they are not restated or adjusted.
What does the 8-quarter trend line show?
Quarterly net profit for the last eight quarters, oldest on the left, always ending on the quarter shown in the row. Two years covers both the seasonal shape of the business and its direction. The line breaks where a quarter is missing rather than drawing across the gap, so a break is a real absence of data and not a reported collapse.
How do I find only the companies that beat estimates in Q2 FY24?
Use the Result filter above the table and choose Beat, or sort by EPS surprise to rank every covered company by how far it landed from consensus. Both are reflected in the page URL, so a filtered view can be bookmarked or shared.
Figures are as reported by companies in their quarterly filings to the exchanges (NSE/BSE), in ₹ crore. Consolidated results are shown where a company reports them, otherwise standalone. Year-on-year and quarter-on-quarter growth is omitted where the comparison period was loss-making, since a percentage change from a negative base is not meaningful. Analyst consensus is an estimate, not a forecast of outcome.